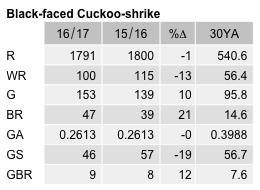
Black-faced Cuckoo-shrike
Coracina novaehollandiae
ABR description
The following is extracted from the Annual Bird Report for the twelve months to June 2017.
Common, breeding resident/summer migrant
A widespread, easily identified, largely summer migrant. Some of the population over-winters here.
General: 3,882 birds recorded (last year 4,180) though far more than the 10YA (1,728) and the 30YA (920). Recorded in every week, with a marked spring and summer peak (both 39%), compared with autumn (17%) and winter (6%). Reporting rate (13%) similar to last year (15%), but below the 10YA (19%) and the 30YA (20%). Recorded from 50% of grid cells surveyed, just above to last year’s 47%, the 10YA (45%) and the 30YA (43%). Max 20 (49 last year), mean 2.1, median 1. 53 breeding records (39 last year), from br/9 Oct Greenway GrJ17 (CnM1) to cf/29 Mar Isaacs Ridge NR-Mugga Lane GrL15 (HeS1).
GBS: 671 birds recorded (last year 760) though fewer than the 10YA (922) and the 30YA (1,085). 460 records (last year 479), fewer than the 10YA (625) and the 30YA (722). Recorded in all weeks with higher proportions in spring (36%) and summer (37%) than in autumn (22%) and winter (5%). Records from 78% of sites, a similar proportion to last year (85%), the 10YA (81%) and the 30YA (87%). Abundance (0.2613) identical to last year, close to the 10YA (0.2881), though lower than the 30YA (0.3988). Max 7 (12 last year), mean 1.5, median 1. 9 breeding records (8 last year) from just 3 sites: first di/5wk Oct Curtin GrK14 (AjR1) and last dy/3wk Holt GrI12 (DaC1).
Abundance
Abundance is the average number of birds of that species per survey. Where the species was observed (presence recorded) but the number of birds seen was not recorded, this is treated as a count of zero.
Abundance by year
This chart shows the abundance of Black-faced Cuckoo-shrike between 1982 and 2017. 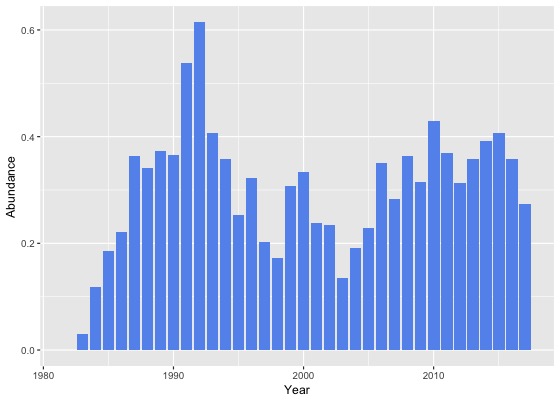
Abundance by month
This chart shows the monthly abundance of Black-faced Cuckoo-shrike. The blue lines show the abundance for the twelve months to June 2017 and the bars show the average abundance for the period 1982 to 2017. 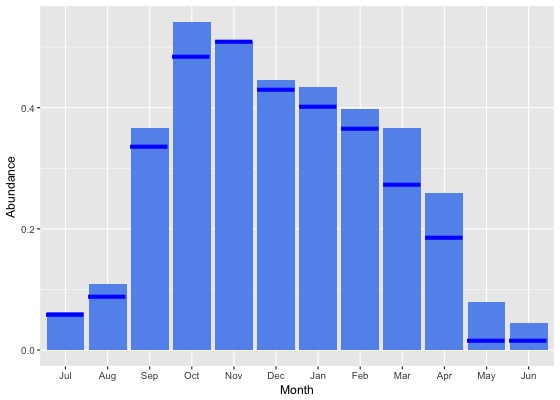
Abundance by season
This chart shows the seasonal abundance of Black-faced Cuckoo-shrike. The blue lines show the seasonal abundance for the twelve months to June 2017 and the bars show the average seasonal abundance for the period 1982 to 2017. 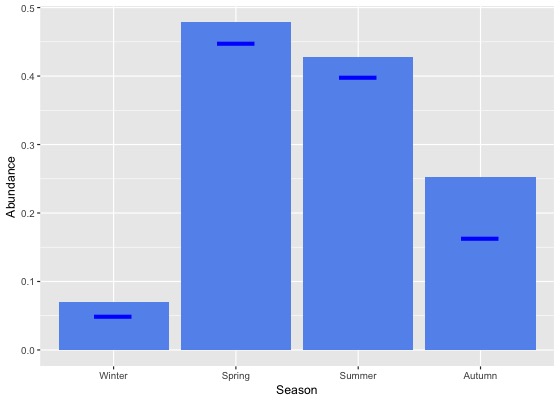
Abundance data
| Month | Season | ||||||||||||||||||
|---|---|---|---|---|---|---|---|---|---|---|---|---|---|---|---|---|---|---|---|
| Period | Jul | Aug | Sep | Oct | Nov | Dec | Jan | Feb | Mar | Apr | May | Jun | Winter | Spring | Summer | Autumn | All | ||
| All years | |||||||||||||||||||
| All | 0.1 | 0.1 | 0.4 | 0.5 | 0.5 | 0.4 | 0.4 | 0.4 | 0.4 | 0.3 | 0.1 | 0.0 | 0.1 | 0.5 | 0.4 | 0.3 | 0.3 | ||
| Previous years | |||||||||||||||||||
| All previous years | 0.1 | 0.1 | 0.4 | 0.5 | 0.5 | 0.4 | 0.4 | 0.4 | 0.4 | 0.3 | 0.1 | 0.1 | 0.1 | 0.5 | 0.4 | 0.3 | 0.3 | ||
| Previous 30 years | 0.1 | 0.1 | 0.4 | 0.6 | 0.5 | 0.5 | 0.4 | 0.4 | 0.4 | 0.3 | 0.1 | 0.1 | 0.1 | 0.5 | 0.4 | 0.3 | 0.3 | ||
| Previous 20 years | 0.0 | 0.1 | 0.4 | 0.6 | 0.5 | 0.4 | 0.4 | 0.4 | 0.4 | 0.3 | 0.1 | 0.0 | 0.1 | 0.5 | 0.4 | 0.3 | 0.3 | ||
| 10 year groups | |||||||||||||||||||
| [2007,2017) | 0.1 | 0.1 | 0.4 | 0.6 | 0.6 | 0.5 | 0.5 | 0.4 | 0.4 | 0.3 | 0.1 | 0.1 | 0.1 | 0.5 | 0.5 | 0.3 | 0.4 | ||
| [1997,2007) | 0.0 | 0.1 | 0.3 | 0.4 | 0.4 | 0.4 | 0.3 | 0.3 | 0.3 | 0.2 | 0.1 | 0.0 | 0.0 | 0.4 | 0.3 | 0.2 | 0.2 | ||
| [1987,1997) | 0.1 | 0.2 | 0.4 | 0.5 | 0.5 | 0.5 | 0.5 | 0.5 | 0.5 | 0.4 | 0.2 | 0.1 | 0.1 | 0.5 | 0.5 | 0.3 | 0.4 | ||
| 5 year groups | |||||||||||||||||||
| [2012,2017) | 0.1 | 0.1 | 0.4 | 0.6 | 0.6 | 0.5 | 0.4 | 0.4 | 0.4 | 0.3 | 0.1 | 0.1 | 0.1 | 0.5 | 0.5 | 0.3 | 0.4 | ||
| [2007,2012) | 0.1 | 0.1 | 0.4 | 0.6 | 0.6 | 0.4 | 0.5 | 0.4 | 0.2 | 0.2 | 0.1 | 0.1 | 0.1 | 0.6 | 0.4 | 0.2 | 0.4 | ||
| [2002,2007) | 0.0 | 0.1 | 0.3 | 0.3 | 0.4 | 0.3 | 0.3 | 0.3 | 0.3 | 0.2 | 0.1 | 0.0 | 0.0 | 0.3 | 0.3 | 0.2 | 0.2 | ||
| [1997,2002) | 0.0 | 0.1 | 0.4 | 0.5 | 0.4 | 0.4 | 0.3 | 0.3 | 0.3 | 0.2 | 0.1 | 0.0 | 0.0 | 0.4 | 0.4 | 0.2 | 0.3 | ||
| [1992,1997) | 0.0 | 0.1 | 0.3 | 0.6 | 0.6 | 0.6 | 0.6 | 0.6 | 0.4 | 0.4 | 0.1 | 0.0 | 0.1 | 0.5 | 0.6 | 0.3 | 0.4 | ||
| [1987,1992) | 0.1 | 0.2 | 0.4 | 0.5 | 0.5 | 0.5 | 0.5 | 0.5 | 0.5 | 0.3 | 0.2 | 0.1 | 0.2 | 0.5 | 0.5 | 0.4 | 0.4 | ||
| Year | |||||||||||||||||||
| 2017 | 0.1 | 0.1 | 0.3 | 0.5 | 0.5 | 0.4 | 0.4 | 0.4 | 0.3 | 0.2 | 0.0 | 0.0 | 0.0 | 0.4 | 0.4 | 0.2 | 0.3 | ||
| 2016 | 0.0 | 0.1 | 0.5 | 0.6 | 0.6 | 0.5 | 0.4 | 0.4 | 0.5 | 0.3 | 0.1 | 0.0 | 0.1 | 0.6 | 0.4 | 0.3 | 0.4 | ||
| 2015 | 0.1 | 0.1 | 0.5 | 0.7 | 0.6 | 0.6 | 0.5 | 0.5 | 0.4 | 0.3 | 0.1 | 0.0 | 0.1 | 0.6 | 0.5 | 0.3 | 0.4 | ||
| 2014 | 0.1 | 0.1 | 0.3 | 0.6 | 0.5 | 0.4 | 0.4 | 0.6 | 0.5 | 0.3 | 0.1 | 0.1 | 0.1 | 0.5 | 0.5 | 0.3 | 0.4 | ||
| 2013 | 0.0 | 0.1 | 0.3 | 0.5 | 0.6 | 0.5 | 0.5 | 0.4 | 0.4 | 0.2 | 0.1 | 0.1 | 0.1 | 0.5 | 0.5 | 0.2 | 0.4 | ||
| 2012 | 0.1 | 0.1 | 0.3 | 0.4 | 0.4 | 0.5 | 0.3 | 0.3 | 0.4 | 0.3 | 0.2 | 0.0 | 0.1 | 0.4 | 0.4 | 0.3 | 0.3 | ||
| 2011 | 0.3 | 0.2 | 0.4 | 0.7 | 0.7 | 0.4 | 0.5 | 0.4 | 0.2 | 0.4 | 0.1 | 0.0 | 0.1 | 0.6 | 0.4 | 0.2 | 0.4 | ||
| 2010 | 0.0 | 0.1 | 0.5 | 0.7 | 0.6 | 0.5 | 0.6 | 0.6 | 0.2 | 0.3 | 0.3 | 0.1 | 0.1 | 0.6 | 0.6 | 0.3 | 0.4 | ||
| 2009 | 0.1 | 0.1 | 0.3 | 0.6 | 0.6 | 0.4 | 0.4 | 0.3 | 0.1 | 0.1 | 0.0 | 0.0 | 0.1 | 0.5 | 0.4 | 0.1 | 0.3 | ||
| 2008 | 0.1 | 0.2 | 0.5 | 0.6 | 0.6 | 0.4 | 0.6 | 0.3 | 0.2 | 0.2 | 0.1 | 0.1 | 0.1 | 0.6 | 0.5 | 0.2 | 0.4 | ||
| 2007 | 0.0 | 0.0 | 0.3 | 0.4 | 0.5 | 0.5 | 0.3 | 0.4 | 0.2 | 0.2 | 0.1 | 0.1 | 0.0 | 0.4 | 0.4 | 0.2 | 0.3 | ||
| 2006 | 0.0 | 0.1 | 0.3 | 0.5 | 0.5 | 0.4 | 0.6 | 0.6 | 0.5 | 0.4 | 0.0 | 0.0 | 0.0 | 0.4 | 0.5 | 0.4 | 0.3 | ||
| 2005 | 0.0 | 0.1 | 0.3 | 0.2 | 0.4 | 0.4 | 0.3 | 0.4 | 0.3 | 0.2 | 0.1 | 0.0 | 0.0 | 0.3 | 0.4 | 0.2 | 0.2 | ||
| 2004 | 0.0 | 0.0 | 0.2 | 0.2 | 0.3 | 0.2 | 0.3 | 0.4 | 0.3 | 0.3 | 0.0 | 0.0 | 0.0 | 0.2 | 0.3 | 0.2 | 0.2 | ||
| 2003 | 0.0 | 0.0 | 0.2 | 0.2 | 0.4 | 0.2 | 0.2 | 0.1 | 0.0 | 0.0 | 0.0 | 0.0 | 0.0 | 0.3 | 0.2 | 0.0 | 0.1 | ||
| 2002 | 0.0 | 0.1 | 0.4 | 0.2 | 0.3 | 0.3 | 0.2 | 0.2 | 0.4 | 0.2 | 0.2 | 0.0 | 0.0 | 0.3 | 0.3 | 0.3 | 0.2 | ||
| 2001 | 0.0 | 0.0 | 0.3 | 0.4 | 0.4 | 0.5 | 0.3 | 0.3 | 0.2 | 0.3 | 0.0 | 0.0 | 0.0 | 0.3 | 0.4 | 0.2 | 0.2 | ||
| 2000 | 0.0 | 0.1 | 0.5 | 0.6 | 0.4 | 0.4 | 0.4 | 0.2 | 0.5 | 0.2 | 0.0 | 0.0 | 0.0 | 0.5 | 0.4 | 0.3 | 0.3 | ||
| 1999 | 0.0 | 0.1 | 0.4 | 0.5 | 0.6 | 0.5 | 0.4 | 0.4 | 0.3 | 0.2 | 0.1 | 0.0 | 0.0 | 0.5 | 0.4 | 0.2 | 0.3 | ||
| 1998 | 0.0 | 0.0 | 0.3 | 0.2 | 0.4 | 0.2 | 0.2 | 0.1 | 0.0 | 0.0 | 0.0 | 0.0 | 0.0 | 0.3 | 0.2 | 0.0 | 0.2 | ||
| 1997 | 0.1 | 0.0 | 0.2 | 0.4 | 0.4 | 0.3 | 0.3 | 0.1 | 0.2 | 0.2 | 0.0 | 0.0 | 0.0 | 0.3 | 0.3 | 0.1 | 0.2 | ||
| 1996 | 0.1 | 0.2 | 0.5 | 0.4 | 0.5 | 0.6 | 0.4 | 0.4 | 0.3 | 0.4 | 0.0 | 0.0 | 0.1 | 0.5 | 0.5 | 0.2 | 0.3 | ||
| 1995 | 0.0 | 0.0 | 0.1 | 0.4 | 0.3 | 0.4 | 0.6 | 0.3 | 0.4 | 0.3 | 0.0 | 0.0 | 0.0 | 0.3 | 0.5 | 0.3 | 0.3 | ||
| 1994 | 0.0 | 0.2 | 0.4 | 1.0 | 0.4 | 0.7 | 0.9 | 0.4 | 0.2 | 0.2 | 0.2 | 0.0 | 0.1 | 0.6 | 0.7 | 0.2 | 0.4 | ||
| 1993 | 0.0 | 0.2 | 0.3 | 0.4 | 1.2 | 1.3 | 0.7 | 0.3 | 0.3 | 0.3 | 0.1 | 0.1 | 0.1 | 0.6 | 0.8 | 0.3 | 0.4 | ||
| 1992 | 0.0 | 0.1 | 0.5 | 1.0 | 0.9 | 0.6 | 0.3 | 1.7 | 1.1 | 1.0 | 0.3 | 0.0 | 0.0 | 0.8 | 0.8 | 0.8 | 0.6 | ||
| 1991 | 0.3 | 0.1 | 0.5 | 0.7 | 0.9 | 0.3 | 0.9 | 1.7 | 0.8 | 0.3 | 0.1 | 0.1 | 0.2 | 0.7 | 0.9 | 0.4 | 0.5 | ||
| 1990 | 0.1 | 0.1 | 0.2 | 0.3 | 0.2 | 0.3 | 0.5 | 0.5 | 1.4 | 0.7 | 0.3 | 0.2 | 0.1 | 0.2 | 0.5 | 0.8 | 0.4 | ||
| 1989 | 0.1 | 0.2 | 0.5 | 0.6 | 0.5 | 0.5 | 0.5 | 0.5 | 0.4 | 0.3 | 0.2 | 0.2 | 0.2 | 0.5 | 0.5 | 0.3 | 0.4 | ||
| 1988 | 0.1 | 0.2 | 0.4 | 0.5 | 0.4 | 0.6 | 0.4 | 0.4 | 0.4 | 0.3 | 0.2 | 0.1 | 0.2 | 0.4 | 0.5 | 0.3 | 0.3 | ||
| 1987 | 0.2 | 0.1 | 0.4 | 0.5 | 0.4 | 0.5 | 0.4 | 0.4 | 0.4 | 0.3 | 0.2 | 0.2 | 0.2 | 0.4 | 0.4 | 0.3 | 0.4 | ||
| 1986 | 0.0 | 0.3 | 0.1 | 0.7 | 0.4 | 0.4 | 0.2 | 0.2 | 0.1 | 0.2 | 0.0 | 0.0 | 0.1 | 0.4 | 0.3 | 0.1 | 0.2 | ||
| 1985 | 0.0 | 0.0 | 0.1 | 0.3 | 0.3 | 0.2 | 0.2 | 0.3 | 0.4 | 0.0 | 0.2 | 0.1 | 0.0 | 0.2 | 0.2 | 0.1 | 0.2 | ||
| 1984 | 0.0 | 0.0 | 0.0 | 0.0 | 0.0 | 0.0 | 0.4 | 0.0 | 0.4 | 0.0 | 0.0 | 0.1 | 0.0 | 0.0 | 0.2 | 0.1 | 0.1 | ||
| 1983 | 0.0 | 0.0 | 0.0 | 0.0 | 0.1 | 0.1 | 0.0 | 0.1 | 0.0 | - | 0.0 | 0.0 | 0.0 | 0.0 | 0.1 | 0.0 | 0.0 | ||
| 1982 | - | 0.0 | - | 0.0 | 0.0 | 0.0 | - | 0.0 | - | 0.0 | - | 0.0 | 0.0 | 0.0 | 0.0 | 0.0 | 0.0 | ||
Reporting rates
Reporting rate is the proportion of all surveys in which the species was present.
Reporting rate by year
This chart shows the reporting rate of Black-faced Cuckoo-shrike each year between 1982 and 2017. 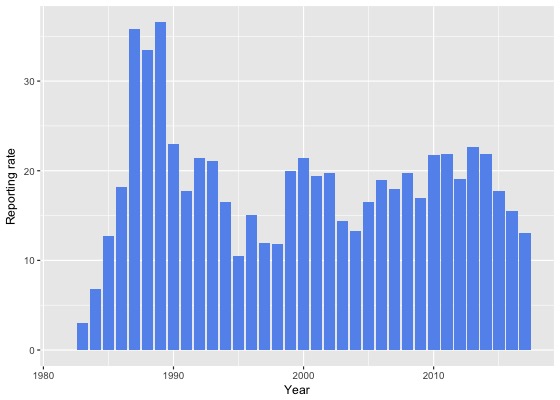
Reporting rate by month
This chart shows the reporting rate by month of Black-faced Cuckoo-shrike. The blue lines show the reporting rate for the twelve months to June 2017 and the bars show the average reporting rate for the period 1982 to 2017. 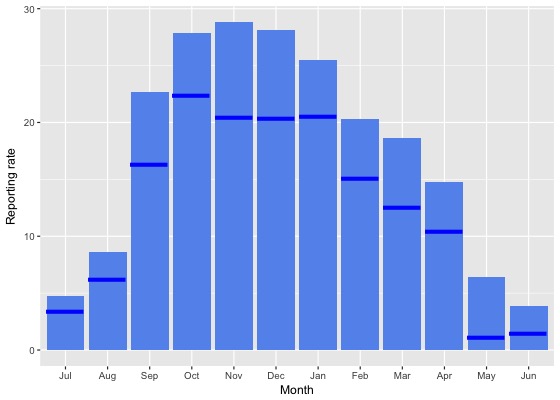
Reporting rate by season
This chart shows the seasonal reporting rate of Black-faced Cuckoo-shrike. The blue lines show the seasonal reporting rate for the twelve months to June 2017 and the bars show the average seasonal reporting rate for the period 1982 to 2017. 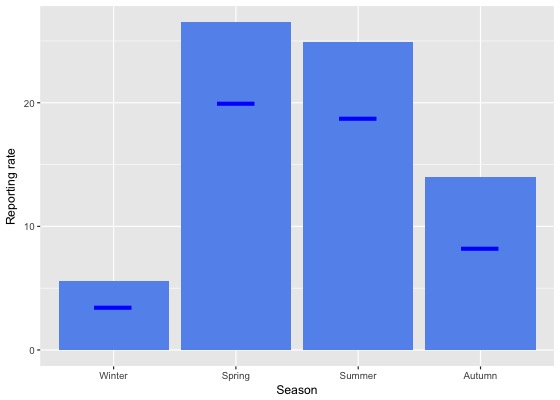
Reporting rate data
| Month | Season | ||||||||||||||||||
|---|---|---|---|---|---|---|---|---|---|---|---|---|---|---|---|---|---|---|---|
| Period | Jul | Aug | Sep | Oct | Nov | Dec | Jan | Feb | Mar | Apr | May | Jun | Winter | Spring | Summer | Autumn | All | ||
| All years | |||||||||||||||||||
| All | 4.7 | 8.6 | 22.6 | 27.8 | 28.8 | 28.1 | 25.5 | 20.3 | 18.6 | 14.7 | 6.4 | 3.9 | 5.6 | 26.5 | 24.9 | 14.0 | 18.8 | ||
| Previous years | |||||||||||||||||||
| All previous years | 4.9 | 9.1 | 23.5 | 28.6 | 30.1 | 29.3 | 26.5 | 21.4 | 19.7 | 15.4 | 7.7 | 4.3 | 6.0 | 27.4 | 26.1 | 15.1 | 19.7 | ||
| Previous 30 years | 5.0 | 9.2 | 23.7 | 28.7 | 30.2 | 29.5 | 26.5 | 21.6 | 19.7 | 15.6 | 7.7 | 4.3 | 6.0 | 27.6 | 26.3 | 15.2 | 19.9 | ||
| Previous 20 years | 4.1 | 7.6 | 22.4 | 27.2 | 28.5 | 27.7 | 25.0 | 19.0 | 18.0 | 13.8 | 6.1 | 3.3 | 4.8 | 26.0 | 24.3 | 13.6 | 18.4 | ||
| 10 year groups | |||||||||||||||||||
| [2007,2017) | 4.8 | 8.2 | 21.8 | 28.1 | 29.2 | 27.5 | 24.9 | 18.6 | 17.6 | 14.3 | 6.3 | 3.8 | 5.4 | 26.5 | 24.0 | 13.6 | 18.8 | ||
| [1997,2007) | 2.9 | 6.2 | 23.5 | 24.0 | 27.1 | 28.0 | 25.2 | 20.2 | 18.8 | 12.7 | 5.7 | 2.3 | 3.5 | 24.7 | 25.1 | 13.6 | 17.5 | ||
| [1987,1997) | 7.9 | 14.2 | 30.6 | 37.7 | 35.8 | 39.9 | 35.7 | 33.8 | 29.8 | 24.4 | 13.6 | 9.4 | 10.7 | 35.0 | 36.6 | 22.9 | 26.7 | ||
| 5 year groups | |||||||||||||||||||
| [2012,2017) | 3.9 | 8.1 | 21.1 | 27.9 | 28.0 | 27.2 | 24.1 | 18.2 | 18.6 | 14.5 | 6.1 | 3.4 | 5.1 | 25.9 | 23.3 | 14.0 | 18.4 | ||
| [2007,2012) | 7.4 | 8.4 | 23.4 | 28.4 | 32.6 | 28.2 | 27.7 | 20.4 | 14.8 | 13.7 | 6.9 | 4.5 | 6.1 | 27.8 | 26.4 | 12.6 | 19.8 | ||
| [2002,2007) | 2.4 | 7.1 | 22.3 | 22.1 | 26.4 | 25.5 | 24.4 | 19.2 | 18.7 | 14.0 | 6.1 | 1.9 | 3.4 | 23.4 | 23.6 | 14.2 | 16.7 | ||
| [1997,2002) | 3.7 | 5.1 | 24.8 | 26.8 | 28.0 | 31.3 | 26.1 | 21.1 | 18.9 | 11.1 | 5.3 | 2.8 | 3.8 | 26.4 | 26.8 | 12.9 | 18.5 | ||
| [1992,1997) | 2.8 | 6.9 | 14.8 | 25.9 | 25.8 | 26.7 | 21.7 | 20.1 | 18.2 | 15.8 | 7.9 | 2.0 | 4.1 | 22.8 | 22.9 | 14.3 | 16.1 | ||
| [1987,1992) | 10.3 | 18.1 | 38.1 | 44.2 | 40.6 | 45.7 | 43.4 | 39.0 | 36.7 | 29.3 | 16.5 | 13.6 | 14.1 | 41.1 | 42.8 | 27.7 | 32.0 | ||
| Year | |||||||||||||||||||
| 2017 | 3.4 | 6.2 | 16.4 | 22.4 | 20.4 | 20.3 | 20.6 | 15.1 | 12.6 | 10.5 | 1.2 | 1.4 | 3.4 | 20.0 | 18.7 | 8.3 | 13.0 | ||
| 2016 | 2.5 | 6.4 | 19.1 | 25.4 | 25.3 | 20.1 | 19.2 | 16.9 | 18.1 | 12.0 | 5.0 | 3.4 | 4.3 | 23.3 | 18.7 | 12.4 | 15.5 | ||
| 2015 | 4.9 | 9.6 | 23.8 | 30.7 | 24.2 | 27.5 | 21.1 | 16.6 | 16.5 | 14.7 | 5.7 | 2.6 | 5.1 | 26.7 | 21.7 | 12.9 | 17.7 | ||
| 2014 | 5.5 | 10.5 | 20.3 | 33.9 | 30.0 | 29.3 | 32.0 | 21.5 | 18.4 | 19.2 | 6.6 | 6.0 | 7.3 | 29.0 | 28.3 | 15.9 | 21.8 | ||
| 2013 | 3.6 | 8.6 | 23.8 | 27.0 | 39.0 | 35.6 | 31.5 | 19.4 | 20.6 | 15.6 | 5.9 | 3.2 | 5.0 | 29.3 | 30.3 | 15.8 | 22.6 | ||
| 2012 | 5.1 | 8.3 | 19.6 | 24.2 | 27.6 | 28.8 | 22.5 | 21.5 | 22.3 | 16.3 | 12.3 | 2.4 | 5.0 | 23.8 | 24.4 | 17.7 | 19.1 | ||
| 2011 | 13.0 | 12.0 | 26.7 | 35.4 | 40.6 | 26.5 | 33.4 | 17.8 | 15.6 | 20.7 | 5.8 | 2.6 | 6.8 | 33.9 | 27.0 | 14.4 | 21.8 | ||
| 2010 | 3.1 | 9.6 | 22.8 | 28.8 | 29.7 | 32.4 | 28.0 | 23.5 | 16.1 | 17.0 | 16.7 | 8.8 | 7.8 | 27.3 | 29.5 | 16.6 | 21.8 | ||
| 2009 | 8.6 | 5.2 | 21.4 | 23.8 | 30.8 | 25.9 | 24.0 | 19.2 | 11.6 | 8.2 | 0.8 | 1.8 | 4.6 | 24.7 | 23.5 | 7.8 | 16.9 | ||
| 2008 | 6.2 | 9.6 | 23.2 | 29.0 | 30.9 | 25.7 | 34.1 | 21.3 | 16.1 | 9.6 | 9.9 | 5.6 | 6.8 | 27.8 | 27.0 | 11.6 | 19.8 | ||
| 2007 | 4.4 | 4.6 | 22.8 | 25.1 | 32.4 | 29.5 | 18.9 | 23.5 | 14.0 | 12.0 | 4.9 | 4.2 | 4.3 | 25.8 | 24.4 | 11.3 | 18.0 | ||
| 2006 | 2.6 | 11.7 | 22.5 | 23.8 | 22.0 | 27.4 | 35.4 | 27.4 | 22.0 | 18.8 | 3.6 | 2.3 | 4.3 | 23.0 | 30.3 | 17.3 | 19.0 | ||
| 2005 | 3.7 | 6.5 | 19.3 | 18.8 | 21.4 | 27.9 | 22.7 | 26.1 | 21.2 | 20.2 | 7.5 | 2.3 | 3.6 | 19.7 | 26.0 | 16.4 | 16.5 | ||
| 2004 | 1.6 | 4.6 | 18.3 | 19.2 | 23.8 | 18.0 | 20.6 | 19.2 | 15.0 | 13.2 | 4.9 | 1.2 | 2.3 | 20.3 | 19.1 | 12.1 | 13.2 | ||
| 2003 | 2.6 | 6.5 | 19.9 | 24.4 | 32.6 | 23.7 | 24.4 | 13.2 | 6.3 | 4.1 | 1.6 | 0.0 | 2.9 | 25.5 | 20.4 | 4.4 | 14.4 | ||
| 2002 | 2.3 | 7.6 | 33.3 | 22.3 | 29.0 | 28.6 | 17.6 | 15.1 | 26.8 | 15.5 | 15.3 | 3.2 | 4.0 | 27.9 | 22.8 | 20.7 | 19.8 | ||
| 2001 | 2.7 | 3.0 | 24.9 | 28.6 | 30.7 | 38.0 | 26.0 | 25.3 | 17.8 | 14.1 | 5.2 | 3.9 | 3.2 | 27.4 | 30.7 | 13.7 | 19.4 | ||
| 2000 | 5.6 | 8.5 | 31.6 | 32.6 | 25.9 | 31.4 | 27.3 | 21.4 | 25.7 | 12.4 | 3.6 | 3.8 | 5.8 | 30.1 | 27.3 | 16.4 | 21.4 | ||
| 1999 | 2.9 | 6.2 | 26.4 | 28.3 | 37.7 | 33.1 | 33.6 | 24.3 | 20.5 | 9.3 | 8.0 | 2.8 | 3.8 | 30.6 | 30.4 | 12.6 | 20.0 | ||
| 1998 | 5.4 | 1.9 | 18.7 | 12.0 | 24.8 | 16.0 | 14.7 | 7.5 | 5.4 | 5.1 | 3.7 | 0.0 | 1.8 | 18.9 | 13.7 | 5.0 | 11.8 | ||
| 1997 | 3.4 | 3.4 | 15.5 | 18.4 | 17.9 | 26.0 | 15.7 | 10.5 | 10.0 | 8.3 | 0.0 | 0.0 | 2.3 | 17.2 | 19.3 | 6.7 | 12.0 | ||
| 1996 | 6.0 | 6.4 | 21.3 | 22.8 | 22.2 | 30.3 | 15.5 | 15.3 | 14.7 | 10.9 | 3.4 | 0.0 | 4.0 | 22.2 | 20.6 | 10.7 | 15.1 | ||
| 1995 | 2.2 | 0.8 | 6.8 | 18.3 | 11.8 | 14.9 | 19.5 | 15.9 | 18.4 | 10.5 | 1.3 | 1.1 | 1.3 | 13.3 | 17.1 | 10.7 | 10.4 | ||
| 1994 | 0.0 | 13.0 | 17.6 | 36.0 | 27.2 | 26.1 | 29.4 | 15.5 | 11.4 | 10.7 | 5.0 | 3.4 | 6.0 | 27.6 | 23.8 | 9.4 | 16.6 | ||
| 1993 | 2.0 | 12.8 | 9.7 | 26.7 | 42.4 | 41.3 | 32.7 | 31.2 | 22.2 | 25.0 | 13.0 | 5.8 | 7.7 | 26.6 | 35.4 | 19.7 | 21.1 | ||
| 1992 | 3.1 | 5.6 | 20.0 | 33.0 | 34.7 | 27.0 | 19.0 | 34.1 | 26.8 | 33.9 | 15.8 | 0.0 | 2.8 | 29.1 | 25.9 | 24.8 | 21.4 | ||
| 1991 | 4.7 | 7.4 | 19.8 | 24.3 | 28.9 | 17.6 | 28.6 | 26.0 | 31.7 | 13.6 | 6.6 | 12.0 | 7.0 | 24.5 | 23.3 | 17.5 | 17.7 | ||
| 1990 | 12.9 | 14.6 | 23.7 | 27.6 | 24.3 | 34.7 | 41.7 | 31.0 | 34.1 | 26.2 | 15.1 | 10.5 | 13.2 | 25.2 | 35.8 | 25.7 | 23.0 | ||
| 1989 | 8.2 | 22.8 | 46.3 | 52.3 | 50.0 | 49.1 | 50.5 | 42.8 | 38.3 | 32.3 | 16.4 | 16.1 | 16.1 | 49.6 | 47.5 | 29.8 | 36.5 | ||
| 1988 | 13.4 | 20.9 | 44.9 | 46.1 | 42.9 | 52.8 | 40.7 | 42.3 | 38.1 | 34.2 | 17.7 | 11.1 | 15.6 | 44.5 | 45.3 | 30.0 | 33.5 | ||
| 1987 | 9.1 | 6.7 | 37.2 | 48.4 | 41.8 | 48.8 | 44.1 | 38.8 | 36.4 | 28.0 | 18.8 | 15.7 | 14.8 | 42.5 | 43.7 | 27.5 | 35.9 | ||
| 1986 | 3.8 | 10.5 | 17.0 | 36.1 | 42.6 | 26.5 | 13.0 | 16.7 | 12.9 | 15.7 | 6.9 | 2.9 | 6.1 | 30.9 | 19.4 | 12.6 | 18.2 | ||
| 1985 | 3.3 | 3.3 | 5.8 | 18.6 | 19.3 | 18.3 | 12.5 | 11.8 | 18.2 | 0.0 | 20.0 | 7.1 | 4.5 | 15.4 | 16.5 | 10.0 | 12.7 | ||
| 1984 | 0.0 | 0.0 | 0.0 | 0.0 | 0.0 | 0.0 | 24.1 | 3.0 | 22.2 | 0.0 | 0.0 | 5.9 | 4.1 | 0.0 | 10.8 | 6.5 | 6.8 | ||
| 1983 | 0.0 | 0.0 | 0.0 | 0.0 | 11.1 | 7.7 | 0.0 | 9.1 | 0.0 | - | 0.0 | 0.0 | 0.0 | 3.7 | 6.7 | 0.0 | 3.0 | ||
| 1982 | - | 0.0 | - | 0.0 | 0.0 | 0.0 | - | 0.0 | - | 0.0 | - | 0.0 | 0.0 | 0.0 | 0.0 | 0.0 | 0.0 | ||
Breeding data
Breeding records by month
Number of breeding records by breeding code and month, 2017 and all years| Breeding code | Jul | Aug | Sep | Oct | Nov | Dec | Jan | Feb | Mar | Apr | May | Jun |
|---|---|---|---|---|---|---|---|---|---|---|---|---|
| 2017 | ||||||||||||
| Breeding (BLA code) | 0 | 0 | 0 | 1 | 2 | 0 | 1 | 0 | 0 | 0 | 0 | 0 |
| Carrying Food | 0 | 0 | 0 | 0 | 1 | 1 | 2 | 0 | 1 | 0 | 0 | 0 |
| Copulating | 0 | 0 | 0 | 0 | 0 | 0 | 0 | 0 | 0 | 0 | 0 | 0 |
| Display | 0 | 0 | 0 | 2 | 0 | 0 | 0 | 0 | 0 | 0 | 0 | 0 |
| Dependent young | 0 | 0 | 0 | 0 | 0 | 1 | 3 | 12 | 2 | 0 | 0 | 0 |
| Faecal sac | 0 | 0 | 0 | 0 | 0 | 0 | 0 | 0 | 0 | 0 | 0 | 0 |
| Inspecting hollow | 0 | 0 | 0 | 0 | 0 | 0 | 0 | 0 | 0 | 0 | 0 | 0 |
| Nest building | 0 | 0 | 0 | 3 | 0 | 1 | 0 | 0 | 0 | 0 | 0 | 0 |
| Nest with eggs | 0 | 0 | 0 | 0 | 1 | 0 | 1 | 0 | 0 | 0 | 0 | 0 |
| Nest with young | 0 | 0 | 0 | 0 | 1 | 0 | 5 | 0 | 0 | 0 | 0 | 0 |
| On/leaving nest | 0 | 0 | 0 | 1 | 7 | 3 | 1 | 0 | 0 | 0 | 0 | 0 |
| All years | ||||||||||||
| Breeding (BLA code) | 0 | 0 | 0 | 2 | 4 | 11 | 14 | 1 | 0 | 0 | 0 | 0 |
| Carrying Food | 0 | 0 | 0 | 5 | 10 | 9 | 8 | 1 | 1 | 0 | 0 | 0 |
| Copulating | 0 | 0 | 0 | 1 | 0 | 1 | 0 | 0 | 0 | 0 | 0 | 0 |
| Display | 0 | 1 | 3 | 8 | 2 | 2 | 1 | 0 | 0 | 0 | 0 | 0 |
| Dependent young | 0 | 0 | 0 | 5 | 24 | 32 | 52 | 50 | 12 | 3 | 0 | 0 |
| Faecal sac | 0 | 0 | 0 | 0 | 0 | 0 | 0 | 1 | 0 | 0 | 0 | 0 |
| Inspecting hollow | 0 | 0 | 0 | 0 | 0 | 0 | 0 | 0 | 0 | 0 | 0 | 0 |
| Nest building | 0 | 0 | 3 | 35 | 18 | 10 | 3 | 2 | 0 | 0 | 0 | 0 |
| Nest with eggs | 0 | 0 | 0 | 5 | 7 | 4 | 3 | 0 | 0 | 0 | 0 | 0 |
| Nest with young | 0 | 0 | 0 | 3 | 17 | 17 | 20 | 5 | 0 | 0 | 0 | 0 |
| On/leaving nest | 0 | 0 | 0 | 28 | 25 | 17 | 5 | 0 | 1 | 0 | 0 | 0 |
Breeding records by year
Average number of breeding records per period by breeding code| Period | Breeding (BLA code) | Carrying Food | Copulating | Display | Dependent young | Faecal sac | Inspecting hollow | Nest building | Nest with eggs | Nest with young | On/leaving nest |
|---|---|---|---|---|---|---|---|---|---|---|---|
| All years | |||||||||||
| All | 0.9 | 0.9 | 0.1 | 0.5 | 4.9 | 0.0 | 0.0 | 2.0 | 0.5 | 1.7 | 2.1 |
| Previous years | |||||||||||
| All previous years | 0.8 | 0.8 | 0.1 | 0.4 | 4.6 | 0.0 | 0.0 | 1.9 | 0.5 | 1.6 | 1.8 |
| Previous 30 years | 0.9 | 1.0 | 0.1 | 0.5 | 5.3 | 0.0 | 0.0 | 2.2 | 0.6 | 1.9 | 2.1 |
| Previous 20 years | 1.4 | 1.0 | 0.1 | 0.7 | 5.0 | 0.0 | 0.0 | 1.9 | 0.0 | 1.4 | 2.8 |
| 10 year groups | |||||||||||
| [2007,2017) | 1.8 | 1.7 | 0.0 | 1.1 | 6.7 | 0.1 | 0.0 | 2.7 | 0.0 | 1.8 | 3.5 |
| [1997,2007) | 1.0 | 0.3 | 0.2 | 0.2 | 3.4 | 0.0 | 0.0 | 1.0 | 0.1 | 1.1 | 2.0 |
| [1987,1997) | 0.0 | 0.9 | 0.0 | 0.2 | 5.9 | 0.0 | 0.0 | 3.0 | 1.6 | 2.7 | 0.9 |
| 5 year groups | |||||||||||
| [2012,2017) | 2.4 | 2.4 | 0.0 | 1.2 | 10.2 | 0.0 | 0.0 | 4.0 | 0.0 | 2.8 | 3.0 |
| [2007,2012) | 1.2 | 1.0 | 0.0 | 1.0 | 3.2 | 0.2 | 0.0 | 1.4 | 0.0 | 0.8 | 4.0 |
| [2002,2007) | 1.4 | 0.4 | 0.2 | 0.0 | 4.4 | 0.0 | 0.0 | 1.8 | 0.0 | 2.2 | 2.4 |
| [1997,2002) | 0.6 | 0.2 | 0.2 | 0.4 | 2.4 | 0.0 | 0.0 | 0.2 | 0.2 | 0.0 | 1.6 |
| [1992,1997) | 0.0 | 0.2 | 0.0 | 0.2 | 1.0 | 0.0 | 0.0 | 1.0 | 0.0 | 1.4 | 0.6 |
| [1987,1992) | 0.0 | 1.6 | 0.0 | 0.2 | 10.8 | 0.0 | 0.0 | 5.0 | 3.2 | 4.0 | 1.2 |
| Year | |||||||||||
| 2017 | 4.0 | 5.0 | 0.0 | 2.0 | 18.0 | 0.0 | 0.0 | 4.0 | 2.0 | 6.0 | 12.0 |
| 2016 | 0.0 | 4.0 | 0.0 | 2.0 | 17.0 | 0.0 | 0.0 | 7.0 | 0.0 | 6.0 | 3.0 |
| 2015 | 0.0 | 2.0 | 0.0 | 3.0 | 11.0 | 0.0 | 0.0 | 2.0 | 0.0 | 3.0 | 3.0 |
| 2014 | 1.0 | 1.0 | 0.0 | 0.0 | 12.0 | 0.0 | 0.0 | 6.0 | 0.0 | 2.0 | 3.0 |
| 2013 | 7.0 | 3.0 | 0.0 | 0.0 | 6.0 | 0.0 | 0.0 | 2.0 | 0.0 | 2.0 | 3.0 |
| 2012 | 4.0 | 2.0 | 0.0 | 1.0 | 5.0 | 0.0 | 0.0 | 3.0 | 0.0 | 1.0 | 3.0 |
| 2011 | 0.0 | 1.0 | 0.0 | 0.0 | 2.0 | 1.0 | 0.0 | 0.0 | 0.0 | 3.0 | 6.0 |
| 2010 | 3.0 | 0.0 | 0.0 | 1.0 | 4.0 | 0.0 | 0.0 | 1.0 | 0.0 | 1.0 | 4.0 |
| 2009 | 1.0 | 2.0 | 0.0 | 2.0 | 1.0 | 0.0 | 0.0 | 2.0 | 0.0 | 0.0 | 4.0 |
| 2008 | 0.0 | 1.0 | 0.0 | 2.0 | 5.0 | 0.0 | 0.0 | 2.0 | 0.0 | 0.0 | 2.0 |
| 2007 | 2.0 | 1.0 | 0.0 | 0.0 | 4.0 | 0.0 | 0.0 | 2.0 | 0.0 | 0.0 | 4.0 |
| 2006 | 2.0 | 0.0 | 0.0 | 0.0 | 3.0 | 0.0 | 0.0 | 2.0 | 0.0 | 5.0 | 3.0 |
| 2005 | 0.0 | 1.0 | 0.0 | 0.0 | 5.0 | 0.0 | 0.0 | 2.0 | 0.0 | 1.0 | 6.0 |
| 2004 | 0.0 | 1.0 | 0.0 | 0.0 | 10.0 | 0.0 | 0.0 | 1.0 | 0.0 | 2.0 | 0.0 |
| 2003 | 4.0 | 0.0 | 1.0 | 0.0 | 4.0 | 0.0 | 0.0 | 1.0 | 0.0 | 1.0 | 2.0 |
| 2002 | 1.0 | 0.0 | 0.0 | 0.0 | 0.0 | 0.0 | 0.0 | 3.0 | 0.0 | 2.0 | 1.0 |
| 2001 | 0.0 | 1.0 | 0.0 | 0.0 | 4.0 | 0.0 | 0.0 | 0.0 | 0.0 | 0.0 | 1.0 |
| 2000 | 1.0 | 0.0 | 0.0 | 0.0 | 3.0 | 0.0 | 0.0 | 1.0 | 0.0 | 0.0 | 2.0 |
| 1999 | 2.0 | 0.0 | 1.0 | 2.0 | 4.0 | 0.0 | 0.0 | 0.0 | 0.0 | 0.0 | 1.0 |
| 1998 | 0.0 | 0.0 | 0.0 | 0.0 | 0.0 | 0.0 | 0.0 | 0.0 | 1.0 | 0.0 | 1.0 |
| 1997 | 0.0 | 0.0 | 0.0 | 0.0 | 1.0 | 0.0 | 0.0 | 0.0 | 0.0 | 0.0 | 3.0 |
| 1996 | 0.0 | 0.0 | 0.0 | 0.0 | 0.0 | 0.0 | 0.0 | 0.0 | 0.0 | 3.0 | 2.0 |
| 1995 | 0.0 | 0.0 | 0.0 | 1.0 | 2.0 | 0.0 | 0.0 | 1.0 | 0.0 | 0.0 | 0.0 |
| 1994 | 0.0 | 1.0 | 0.0 | 0.0 | 0.0 | 0.0 | 0.0 | 1.0 | 0.0 | 1.0 | 1.0 |
| 1993 | 0.0 | 0.0 | 0.0 | 0.0 | 1.0 | 0.0 | 0.0 | 1.0 | 0.0 | 2.0 | 0.0 |
| 1992 | 0.0 | 0.0 | 0.0 | 0.0 | 2.0 | 0.0 | 0.0 | 2.0 | 0.0 | 1.0 | 0.0 |
| 1991 | 0.0 | 0.0 | 0.0 | 1.0 | 0.0 | 0.0 | 0.0 | 0.0 | 1.0 | 0.0 | 3.0 |
| 1990 | 0.0 | 0.0 | 0.0 | 0.0 | 3.0 | 0.0 | 0.0 | 1.0 | 3.0 | 0.0 | 0.0 |
| 1989 | 0.0 | 4.0 | 0.0 | 0.0 | 18.0 | 0.0 | 0.0 | 11.0 | 3.0 | 6.0 | 2.0 |
| 1988 | 0.0 | 2.0 | 0.0 | 0.0 | 21.0 | 0.0 | 0.0 | 5.0 | 6.0 | 4.0 | 1.0 |
| 1987 | 0.0 | 2.0 | 0.0 | 0.0 | 12.0 | 0.0 | 0.0 | 8.0 | 3.0 | 10.0 | 0.0 |
| 1986 | 0.0 | 0.0 | 0.0 | 0.0 | 0.0 | 0.0 | 0.0 | 0.0 | 0.0 | 0.0 | 0.0 |
| 1985 | 0.0 | 0.0 | 0.0 | 0.0 | 0.0 | 0.0 | 0.0 | 0.0 | 0.0 | 0.0 | 0.0 |
| 1984 | 0.0 | 0.0 | 0.0 | 0.0 | 0.0 | 0.0 | 0.0 | 0.0 | 0.0 | 0.0 | 0.0 |
| 1983 | 0.0 | 0.0 | 0.0 | 0.0 | 0.0 | 0.0 | 0.0 | 0.0 | 0.0 | 0.0 | 0.0 |
| 1982 | 0.0 | 0.0 | 0.0 | 0.0 | 0.0 | 0.0 | 0.0 | 0.0 | 0.0 | 0.0 | 0.0 |
Distribution map
Distribution - 2017
This map shows the observed distribution of the Black-faced Cuckoo-shrike for 2017.
The red circles are the grid cells where Black-faced Cuckoo-shrike have been reported.
The transparency of the red circles indicate how many surveys sheets were submitted for that grid cell; the darker the red the more reliable the data. Of the 315 grid cells with reports, 83 had only one sheet; an example is grid number E3.
The size of the circle represents the reporting rate. The maximum reporting rate for Black-faced Cuckoo-shrike was 100.0% (eg grid number E3) and the minimum was 2.0% (eg grid number K15). 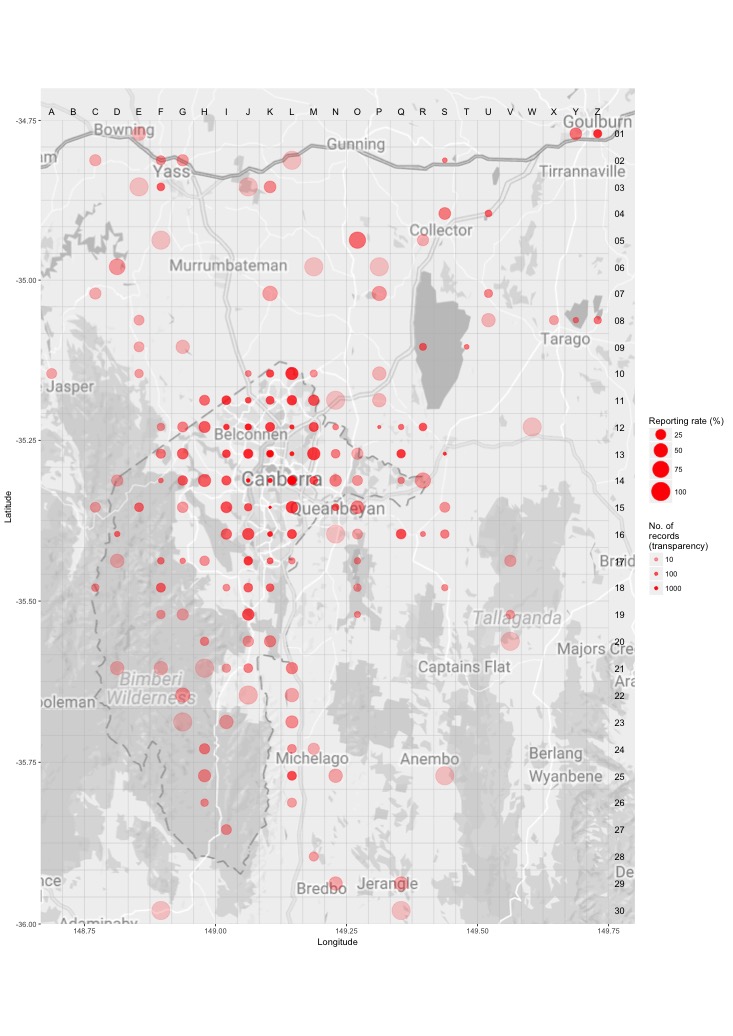
Distribution - all years
This map shows the observed distribution of the Black-faced Cuckoo-shrike for all years.
The red circles are the grid cells where Black-faced Cuckoo-shrike have been reported.
The transparency of the red circles indicate how many surveys sheets were submitted for that grid cell; the darker the red the more reliable the data. Of the 703 grid cells with reports, 55 had only one sheet; an example is grid number C10.
The size of the circle represents the reporting rate. The maximum reporting rate for Black-faced Cuckoo-shrike was 100.0% (eg grid number A7) and the minimum was 2.3% (eg grid number S13). 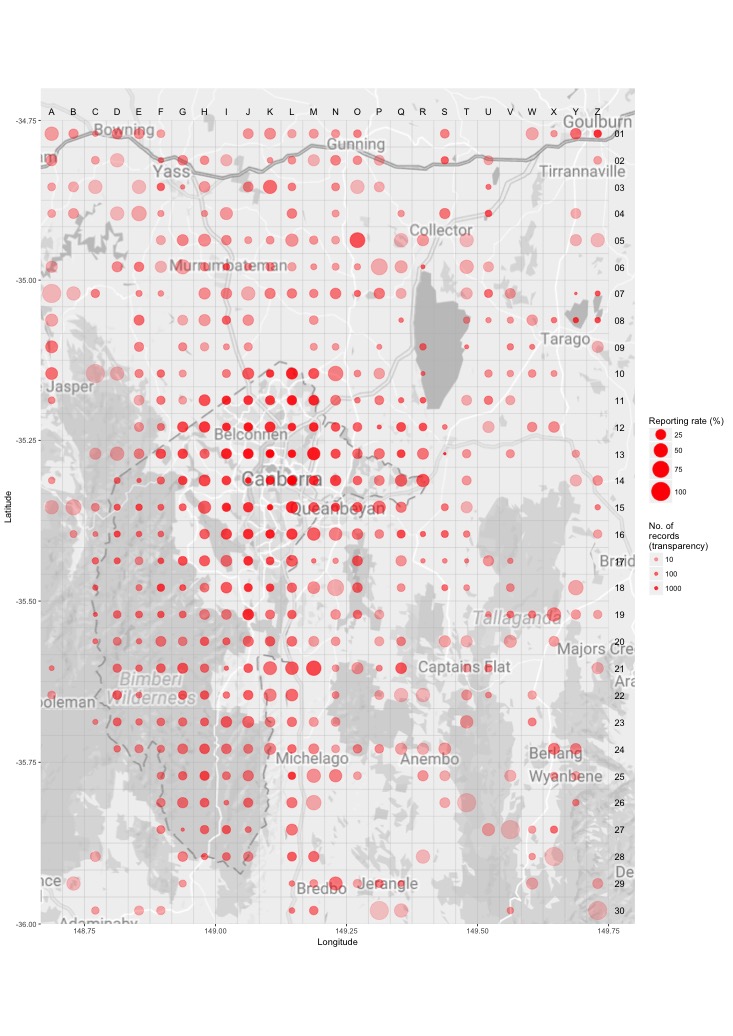
Breeding map
Breeding - 2017
This map shows the breeding distribution of the Black-faced Cuckoo-shrike for 2017.
The red circles are the grid cells where breeding activity for Black-faced Cuckoo-shrike have been reported.
The size of the circle represents the number of reports. 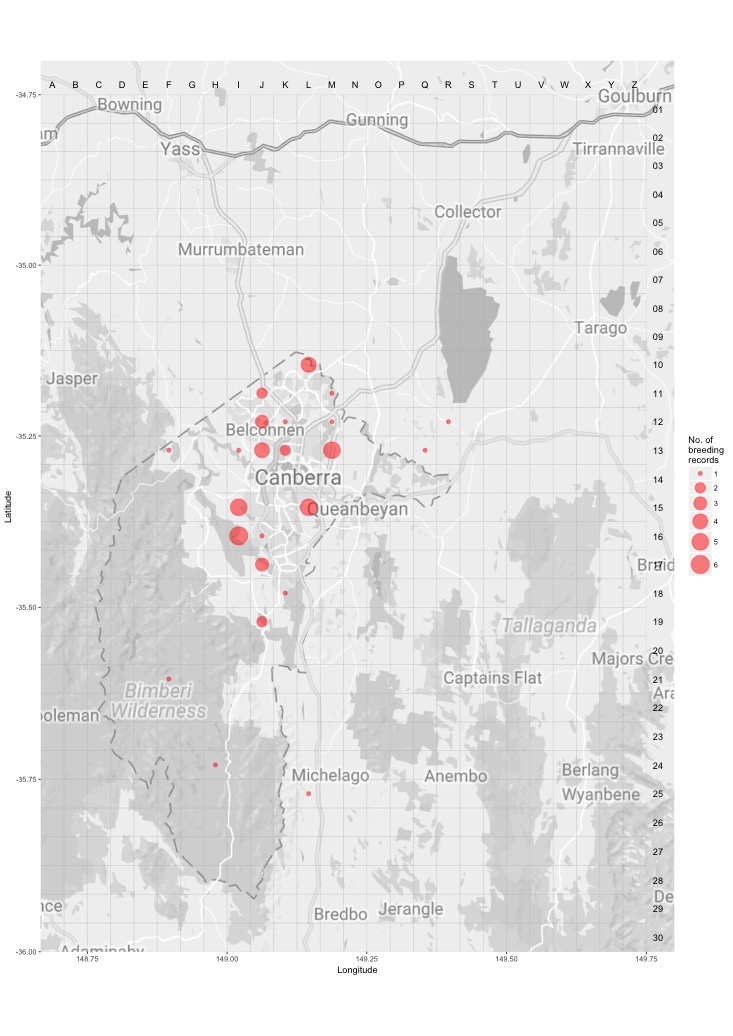
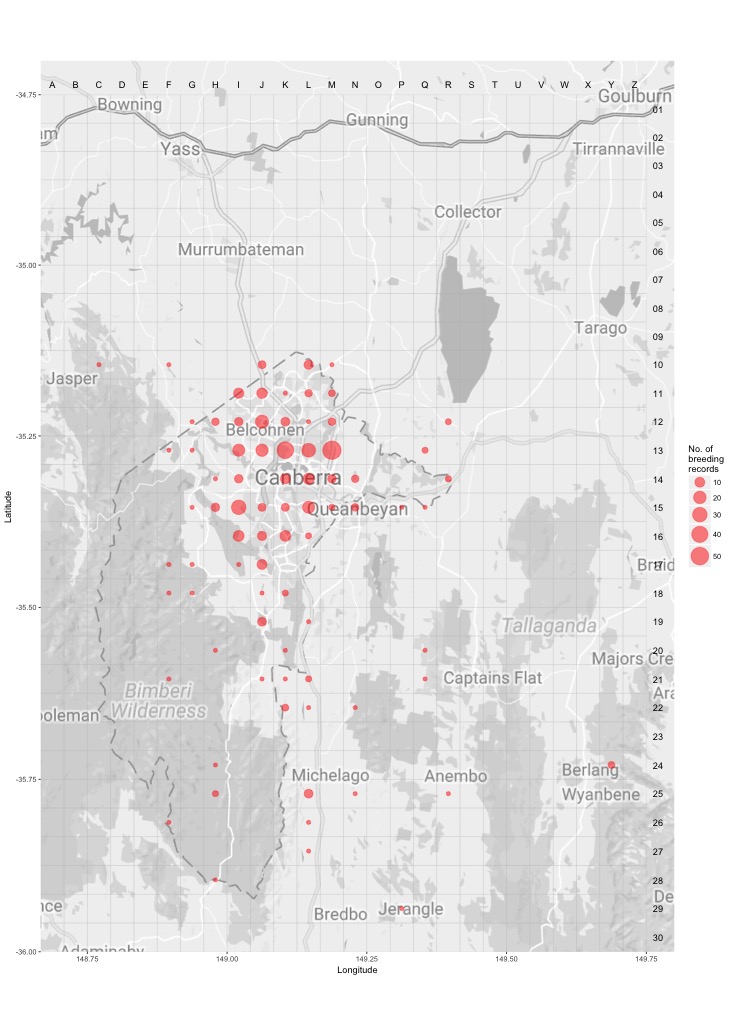
Breeding - all years
This map shows the breeding distribution of the Black-faced Cuckoo-shrike for all years.
The red circles are the grid cells where breeding activity for Black-faced Cuckoo-shrike have been reported.
The size of the circle represents the number of reports.